Facebook Insights is the Facebook analytics feature of your Facebook page. In other words, it’s a free tool you can use to check how well your Facebook page is performing as well as provides detailed information about your audience.
There are many benefits to using Facebook insights. The first benefit is the ability to conduct a Facebook audience analysis. In other words, collecting information about their age, gender and location.
This information is really handy especially when you want to know who to target with your Facebook ads. Facebook Insights will tell you what demographics your business attracts so you don’t need to spend too much time or money with trial and error.
Another benefit of conducting a Facebook audience analysis is the fact that it gives you the ability to fine tune your content accordingly. If for example you’ve noticed you’re attracting a majority of women over 30, you might want to make sure your posts are more geared towards them.
If you’d like to take your Facebook marketing to the next level, and increase the results you’re getting from your current Facebook marketing efforts by 10, click here to download my FREE Facebook marketing report. Simply enter your name and email and I’ll instantly send you the report.
Another benefit of checking Facebook analytics is that it gives you the ability to see which posts are performing the best and which ones are performing the least well. This will allow you to know what content to create for future posts so you can always maintain a higher level of engagement.
Plus, if you notice a post has performed particularly well, you can turn the post into an ad.
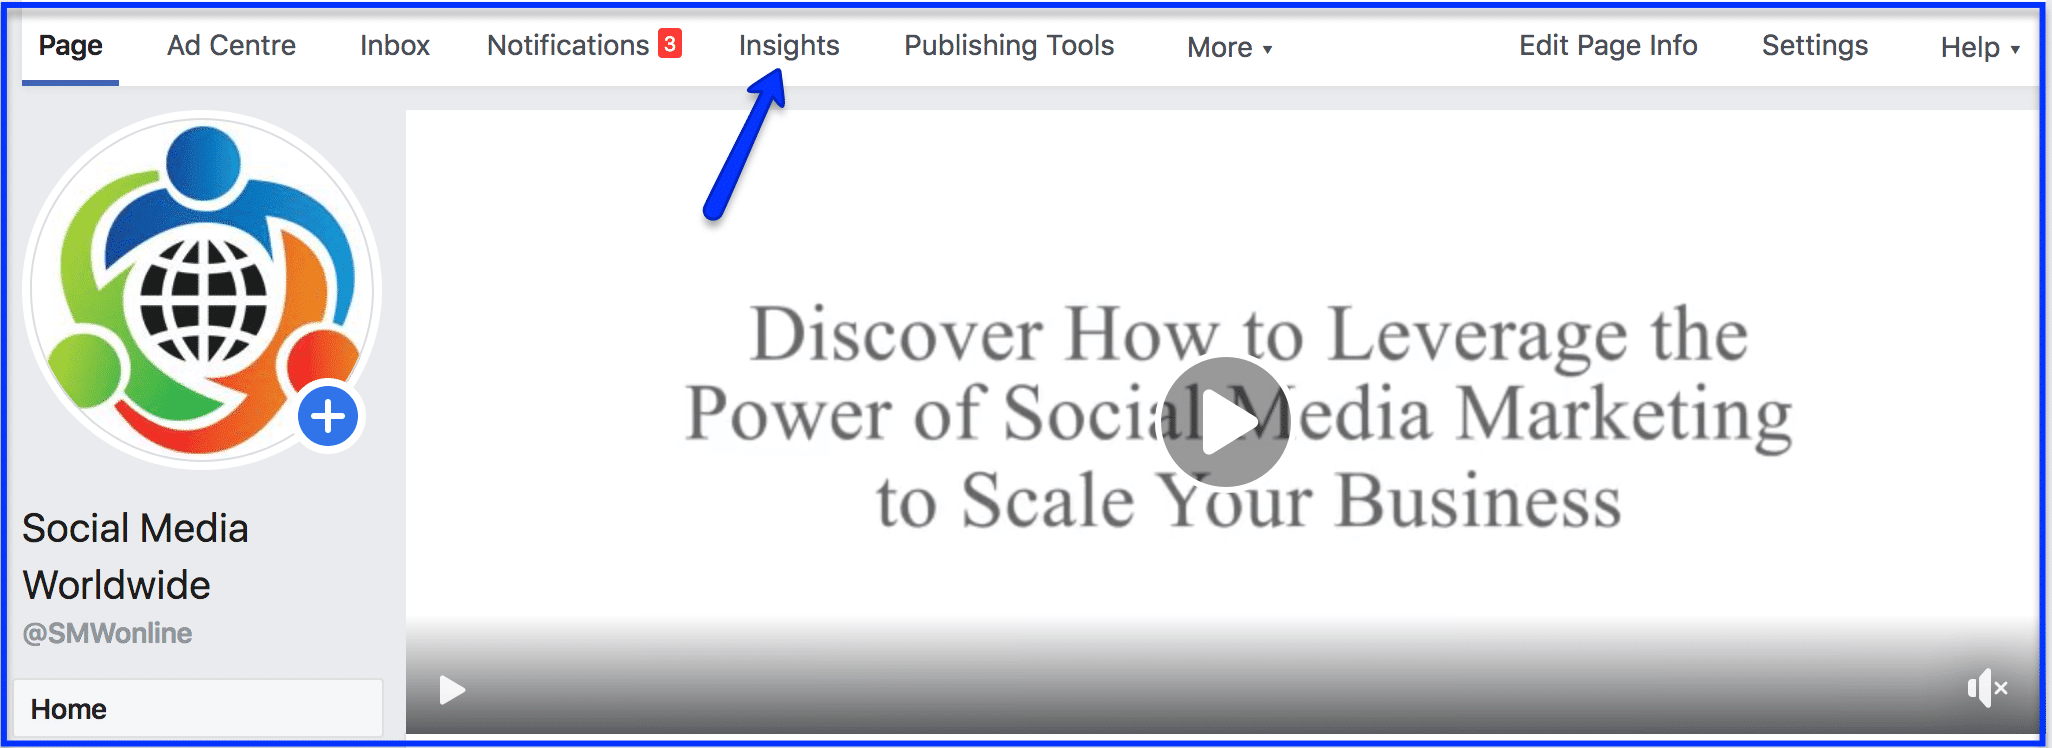
To access your Facebook analytics dashboard, simply go to your page and click on “insights” at the top of the page. When you do, you’ll notice the Facebook analytics dashboard is divided in two.
On the left hand side is a menu bar of all the types of analytics you can access, such as Facebook analytics on your followers, or analytics on your posts. On the right hand side you will see the graphs for these statistics.
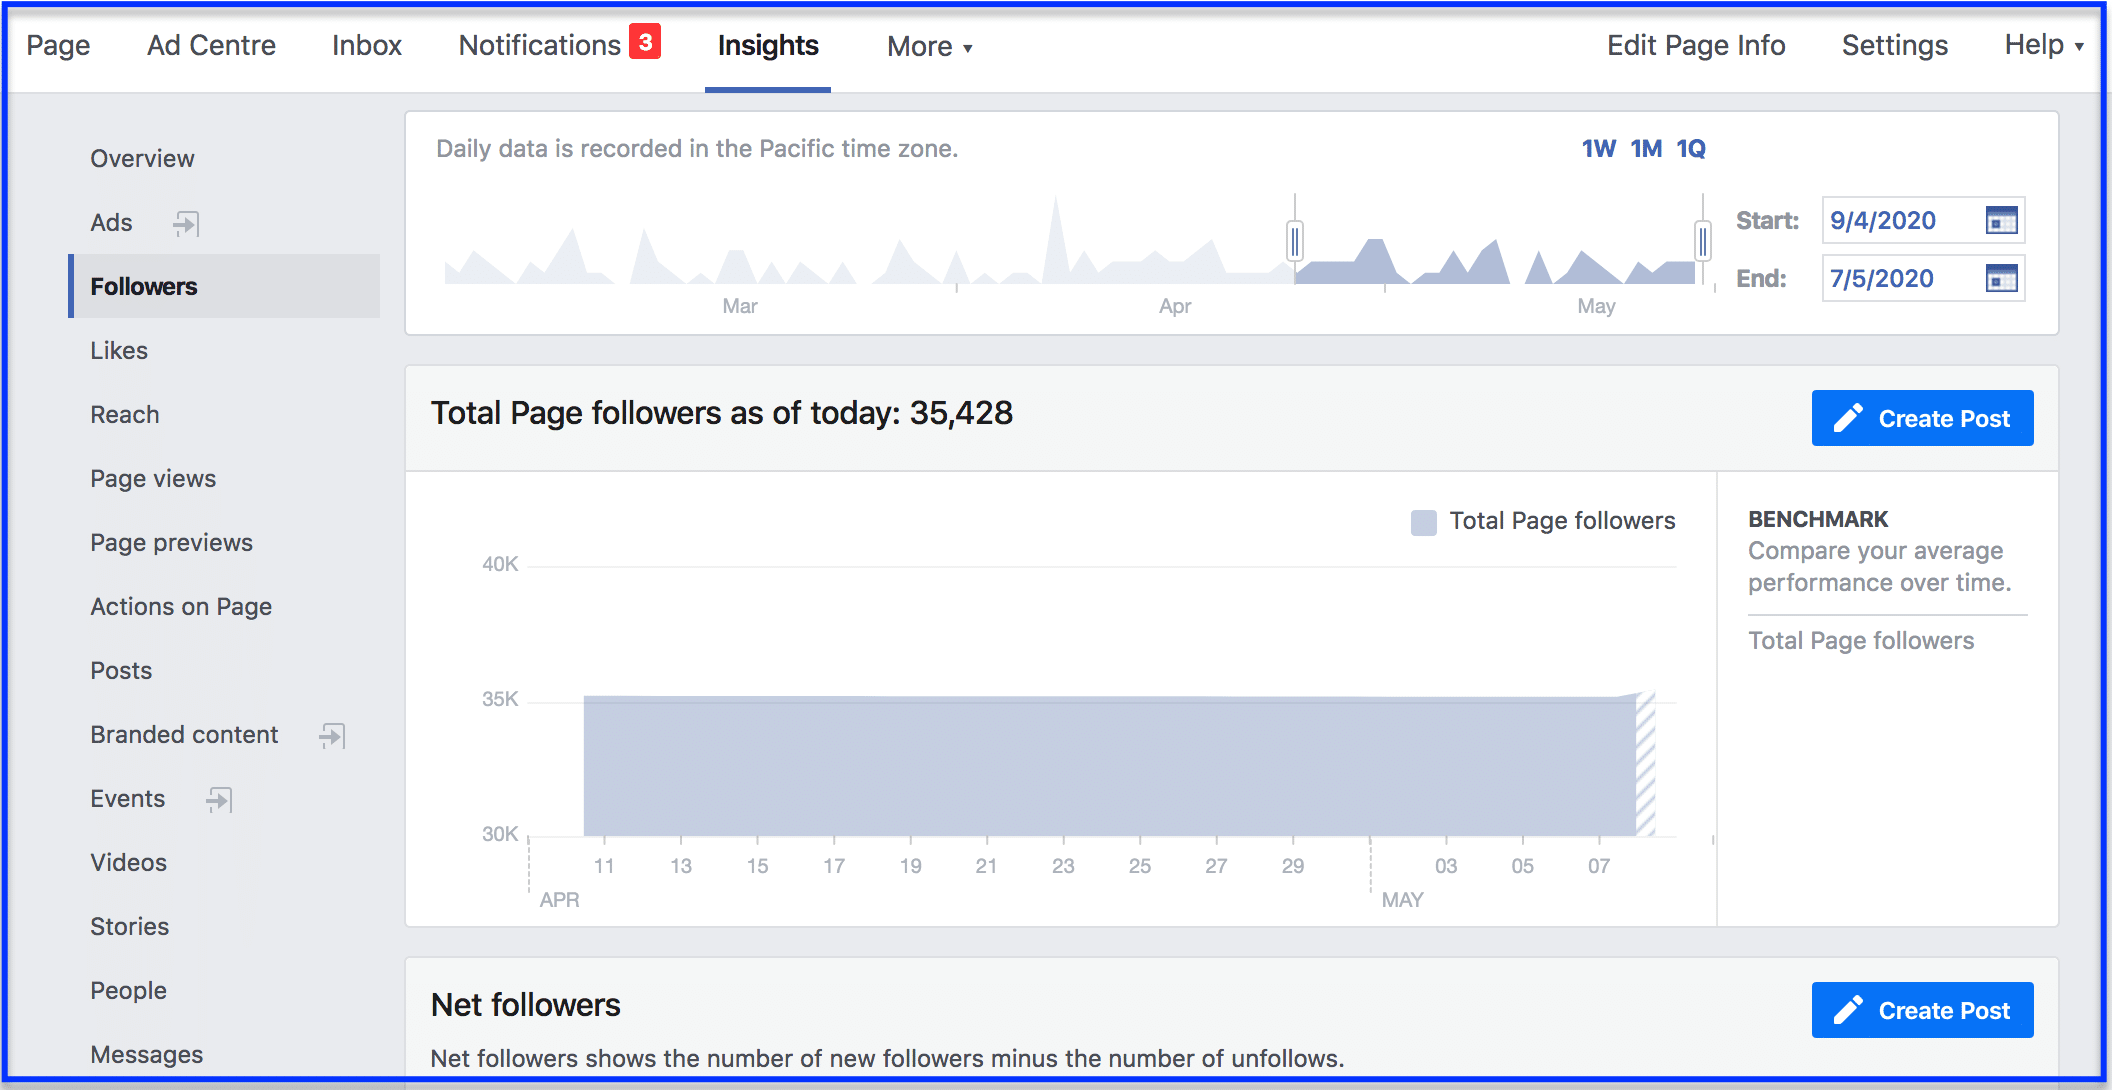
When looking at your Facebook insights, you can always choose the timeframe you want to focus on by clicking on the calendar symbol.
If you click on “followers” for example, you’ll be able to see graphs of how many followers you have in total, you’ll also be able to see a graph with your net followers, in other words, the number of new followers minus the number of unfollows your page has received.
You’ll also be able to see how many followers were acquired organically, in other words, not as a result of using Facebook ads, and how many were acquired through Facebook ads.
Another graph provides information about where the followers came from, if they followed your page anywhere from a desktop computer or followed your page as a result of being on your page.
The likes tab gives you very similar information. You’ll notice you’ll be able to see how many total likes your page has, how many net likes you have, how many likes were acquired organically and how many were acquired as a result of Facebook advertising, and where the page likes happened.
Whether people liked your page from seeing your page in their newsfeed, or from people who were visiting your Facebook page, etc…
If you’d like to take your Facebook marketing to the next level, and increase the results you’re getting from your current Facebook marketing efforts by 10, click here to download my FREE Facebook marketing report. Simply enter your name and email and I’ll instantly send you the report.
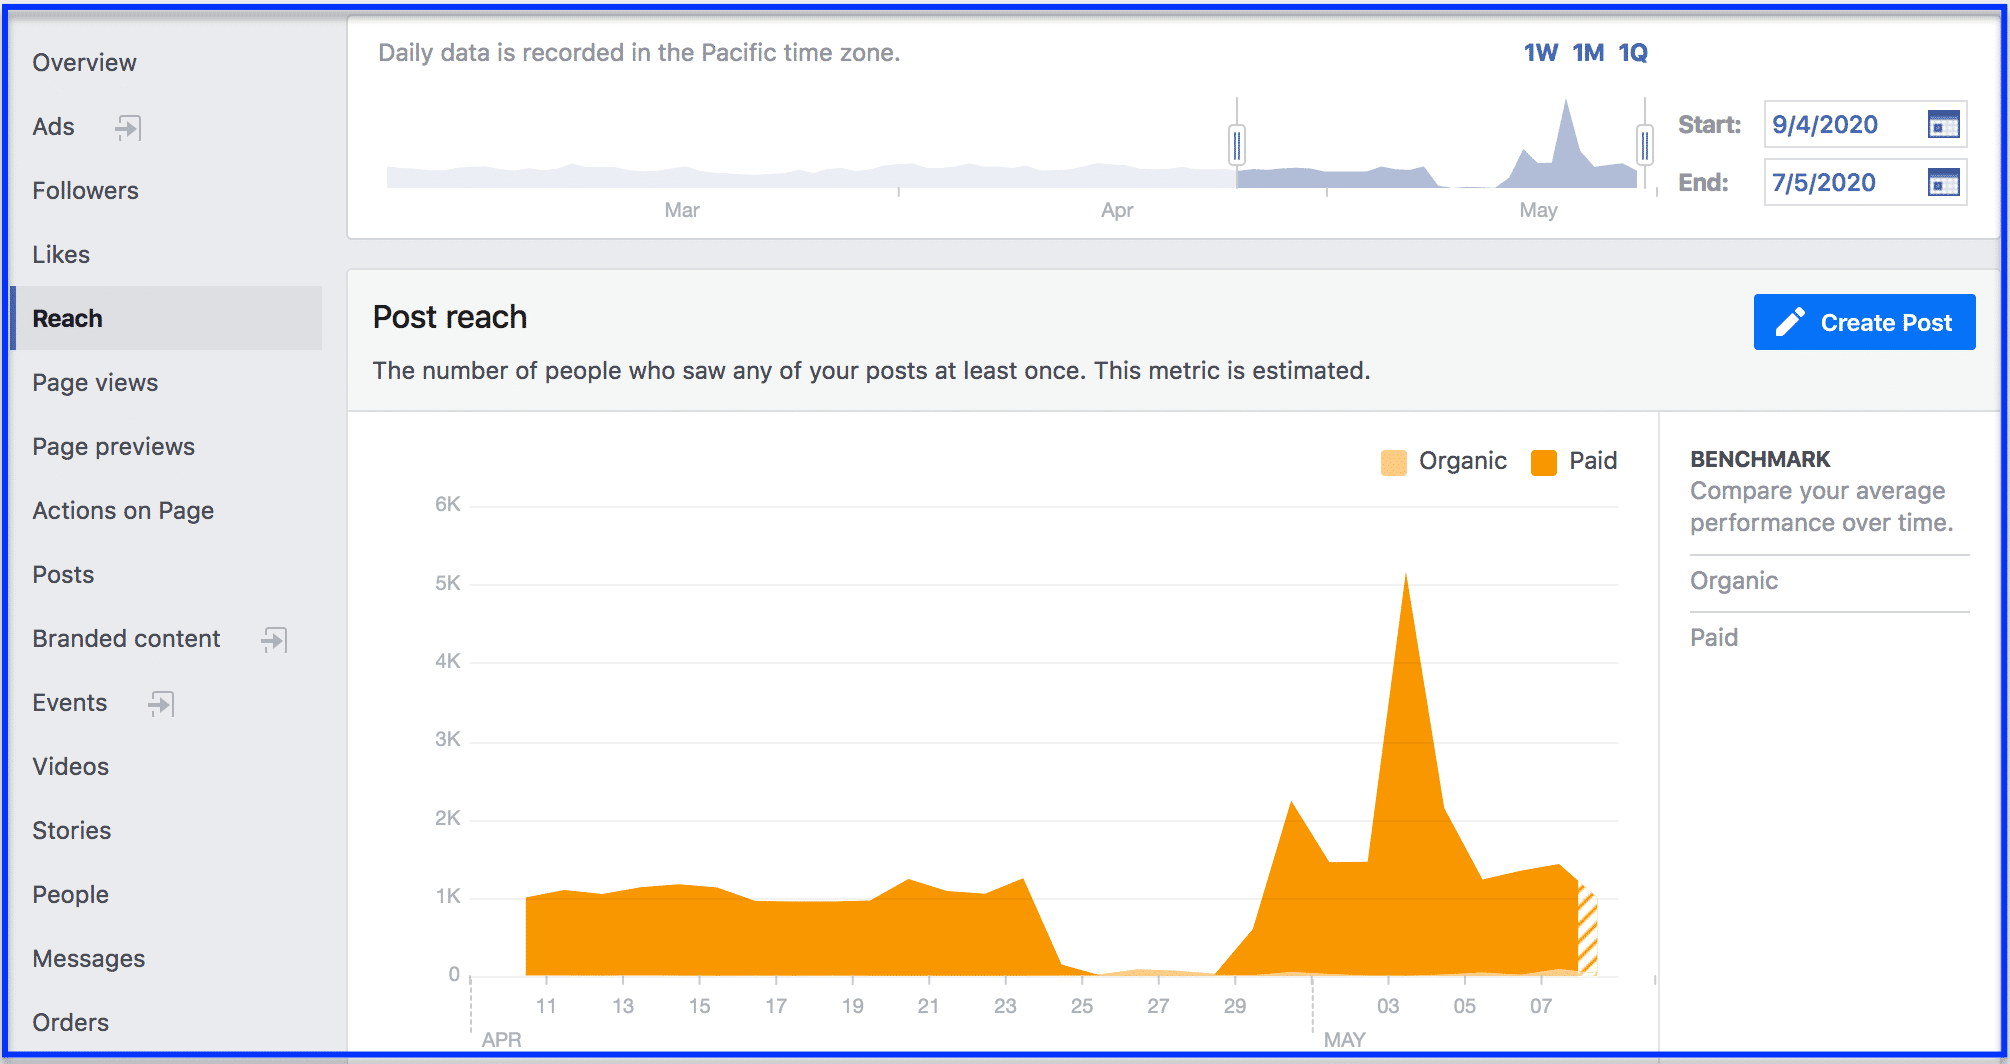
The reach tab is also a very important fb marketing metric to check. Reach is the number of people who saw your posts at least once. Without reach, you can’t achieve anything because it means no one is seeing your posts and no one can engage with your fb marketing content.
So making sure your reach is high is important. When you click on the tab, you’ll see how many people have seen your posts organically, in other words, without you relying on Facebook ads to show your posts, and how many people have seen your ads thanks to Facebook ads.
If your organic reach is low, which is the case nowadays for everyone, it means that you have to start using Facebook ads.
Below you’ll also see how many people have recommended your page and when. In other words, whether you have benefited from word of mouth. If you have, take notice of the day it happened and check what you did on Facebook that could have enticed people to recommend your page, as you’ll want to do it again, since word of mouth is free and people trust recommendations more.
Below you’ll also see a chart displaying how many reactions, comments, shares and any other engagements your posts have generated. If you notice a spike on a certain day, once again check what you published that day that could have caused the spike so you can do something similar.
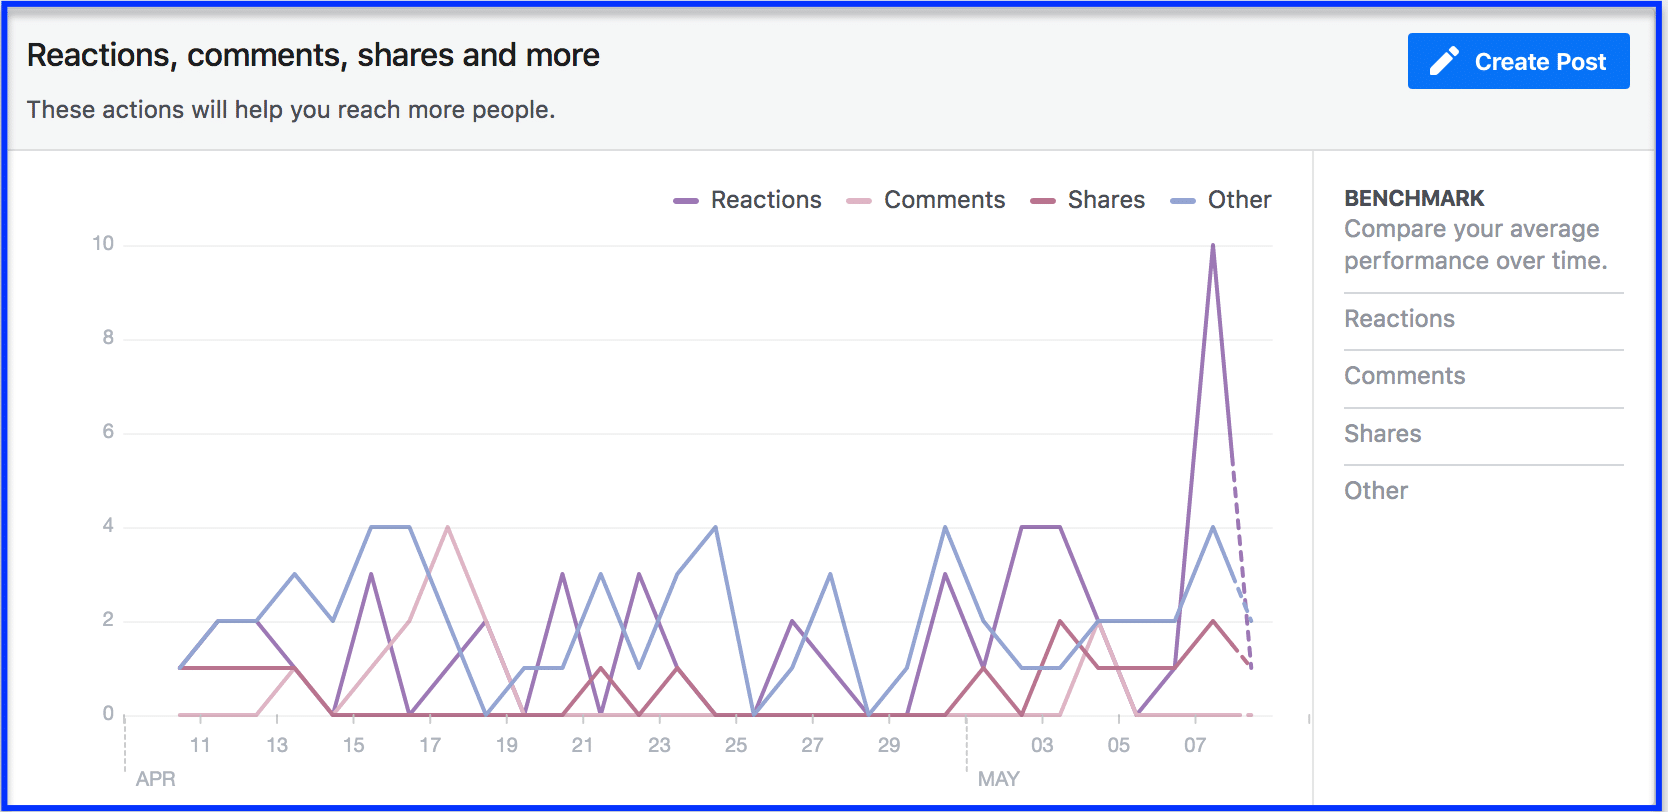
Below is a chart displaying what kind of reactions your posts generated. There are 6 types of reactions posts can generate from funny to angry and you can see what types are the most popular for your posts.
Below there’s another important chart that displays whether people hid your posts, reported you as spam or unliked your page. If this occurred, this is a clear indication some of your content didn’t resonate with your audience. So check when it occurred, and what post could have triggered that response to avoid it in the future.
Another important fb marketing metric in Facebook insights is the posts metric. First, it displays when your audience is online, which day of the week and what time. This is important Facebook audience analysis information because it clearly indicates what day of the week and what times are best to publish your posts.
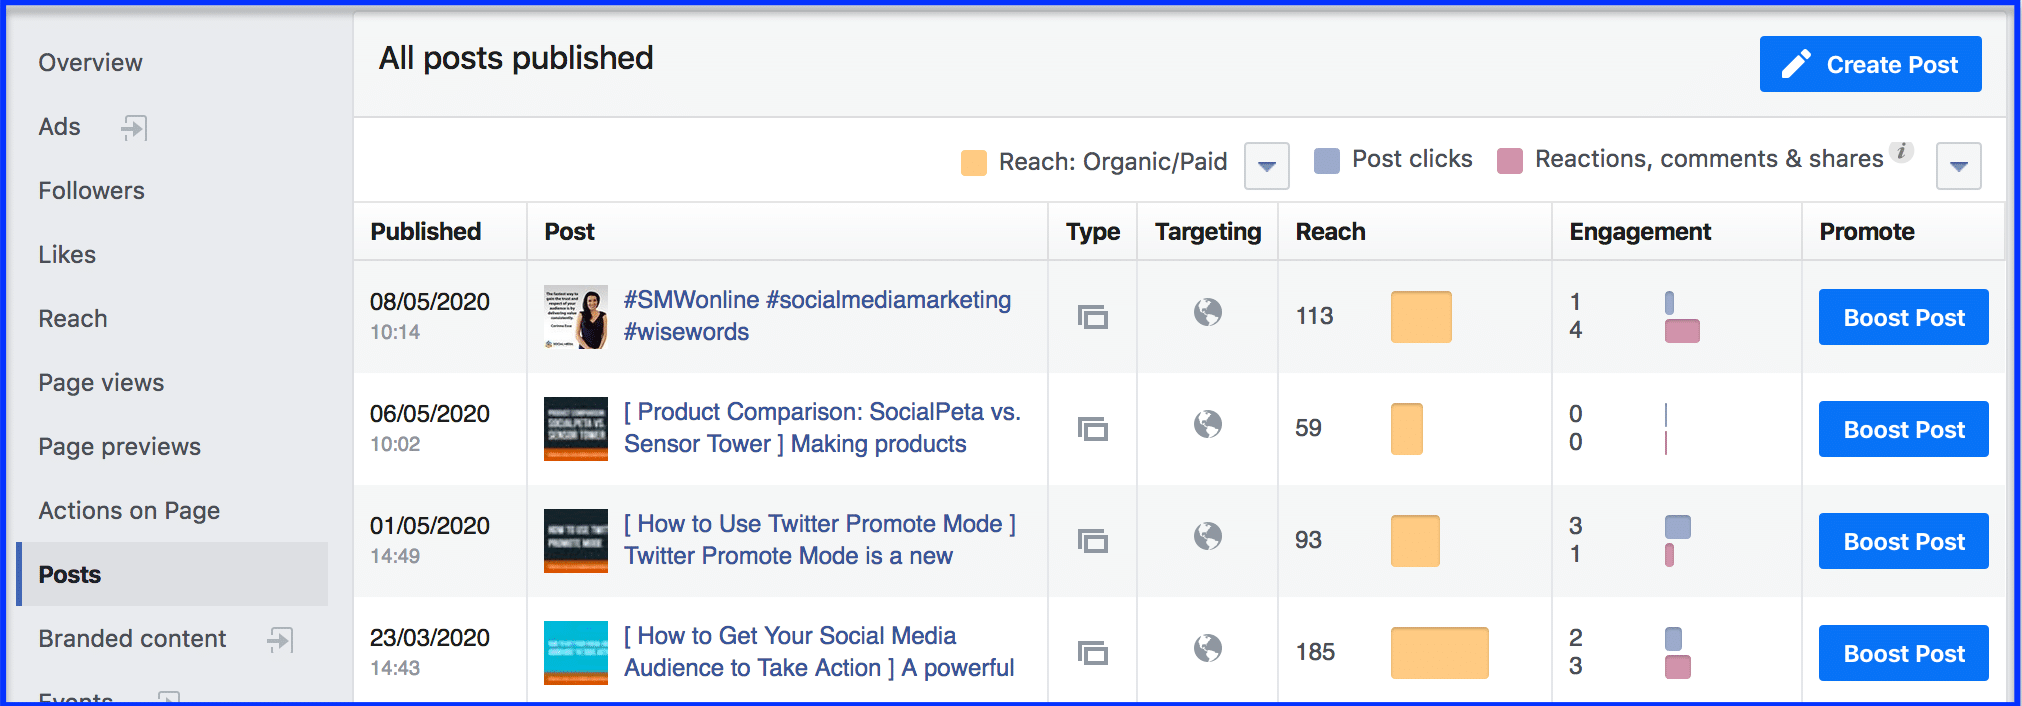
Below, you’ll see all your posts listed, and several columns for each post. The first column indicates what type of post it was, such as a photo or a video, the next column indicates the targeting, the next column indicates how many people were reached and the last column indicates the number of engagements each post received.
If certain posts stand out, make a note of the time and day it was posted and the type of post it was.
Lastly, another very important fb marketing metric you can find on the Facebook analytics dashboard is called “people”. When you click on the “people” tab, you’ll be able to see your audience’s demographics. In other words, how many are women, how many are men, their age group and their geographic location.
This Facebook audience analysis information is important for two reasons. First, because you’ll be able to adapt your posts accordingly. If for example, your audience is mainly based in the UK, you might want to write posts that refer to British culture and some important British holidays or events.
Or if you notice that your audience is mainly made of people in their twenties, you might want to adapt your fb marketing posts based on their interests as they can be very different from the interests of older generations. The second reason is because if you decide to run some Facebook ads, you’ll know which audience demographics are best to target.
If you’d like to take your Facebook marketing to the next level, and increase the results you’re getting from your current Facebook marketing efforts by 10, click here to download my FREE Facebook marketing report. Simply enter your name and email and I’ll instantly send you the report.
Remember to also subscribe to our Youtube channel for the latest social media marketing tips and tricks.
About the Author

Corinna Essa is known internationally as the go-to person when it comes to social media marketing.
Corinna owns a social media marketing company helping businesses around the world leverage the power of social media without doing any of the legwork. Her company has been featured in many media outlets including Sky Business news, Working Women magazine, Ymagazine, Tasmanian Times, Channel 7 and 101fm.
Corinna is also the author of 2 bestselling books “Money On Demand – The 16 Fastest Ways to Becoming a Millionaire Online” and “Reach: The SECRETS to converting your social media audience into your network marketing downline fast”
Hey, I must say that this the best blog about Facebook. I wanted to know from many times that what is Facebook insights and how to use it. after reading this I came to know. Thank you….!!